
library(tidyverse)
library(ggridges)
Quarto
First, let’s make sure you know how to use Markdown formatting to style a Quarto document.
Make this text bold.
Make this text italicized.
Make these into a bullet point list:
- Apples
- Bananas
- Potatoes
Edit the YAML to remove warning messages from being output in the rendered HTML file
Using code chunk options, make it so this chunk shows the plot but not the source code:
- Using code chunk options, remove the messages about bandwidth
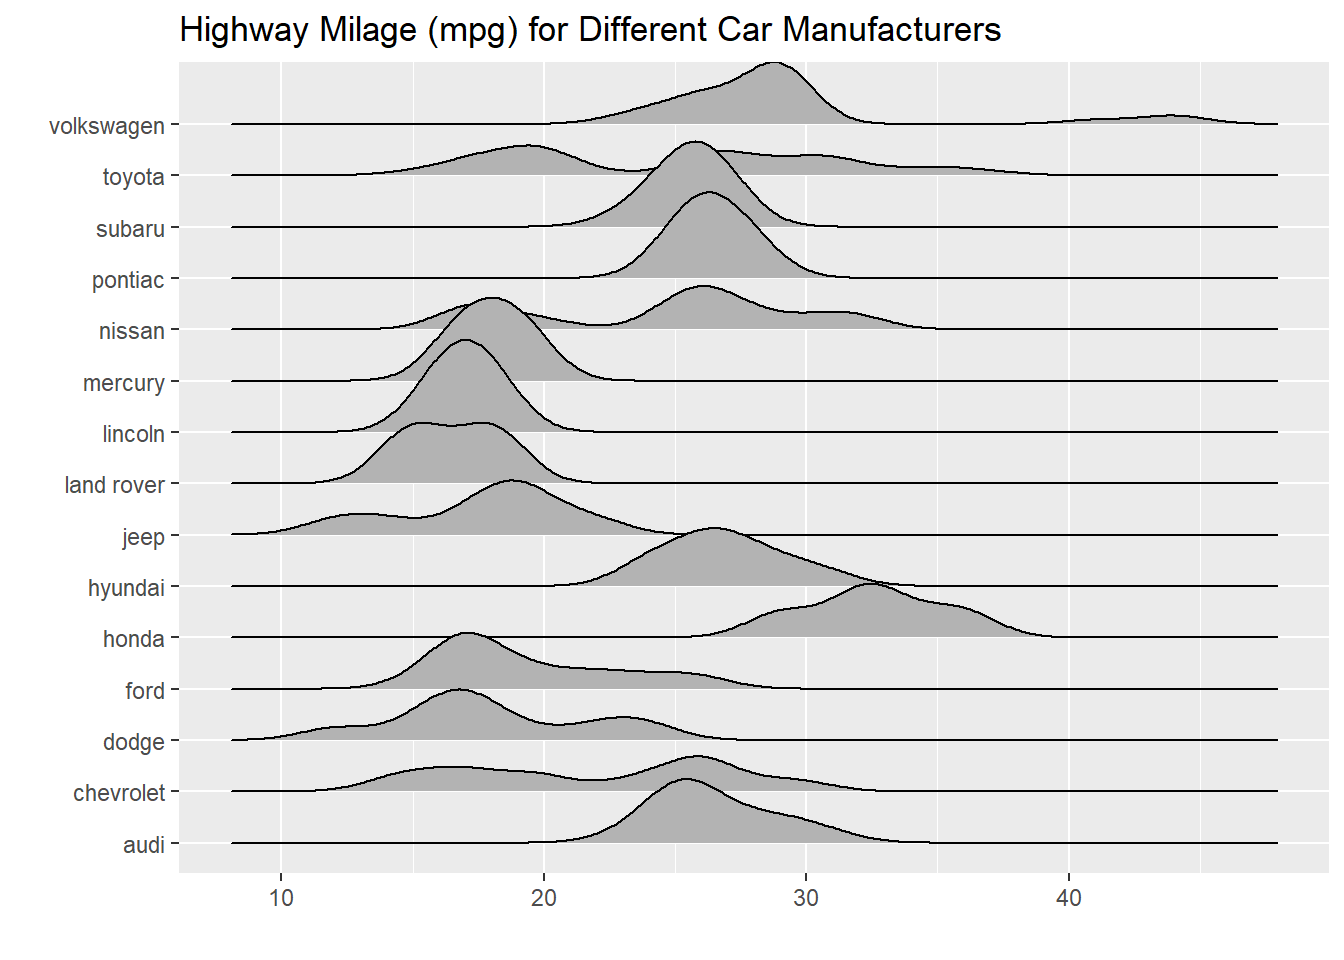
geom_density_ridges()chose to use:
ggplot(data = mpg, mapping = aes(y = manufacturer, x = hwy)) +
  geom_density_ridges() +
  labs(
    x = "",
    y = "",
    title = "Highway Milage (mpg) for Different Car Manufacturers"
  )
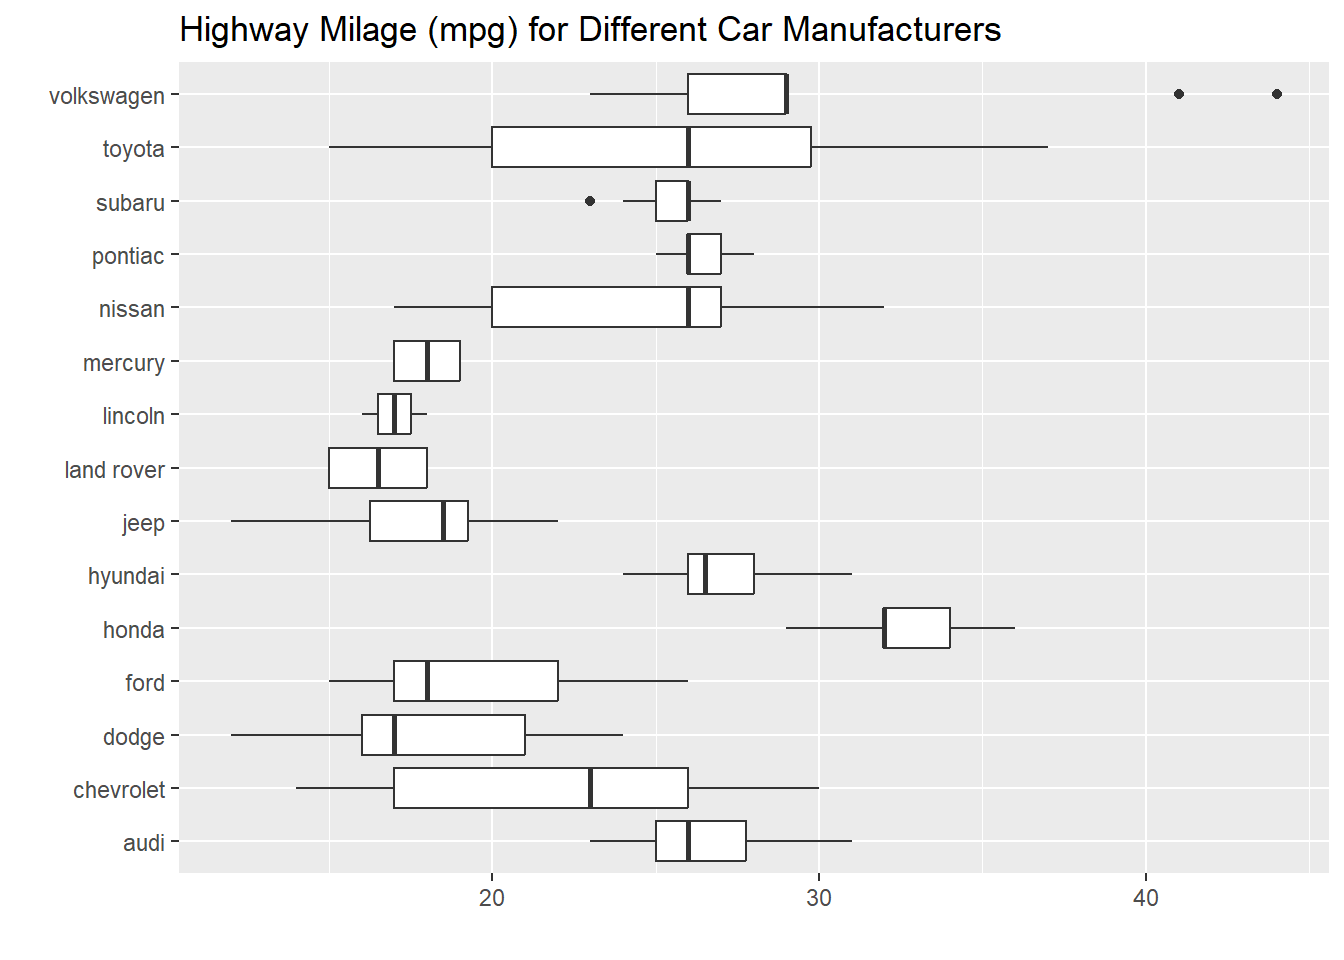
- Using code chunk options, make it so that these plots are printed side-by-side:
ggplot(data = mpg, mapping = aes(y = manufacturer, x = hwy)) +
  geom_boxplot() +
  labs(
    x = "",
    y = "",
    title = "Highway Milage (mpg) for Different Car Manufacturers"
  )
ggplot(data = mpg, mapping = aes(y = manufacturer, x = hwy)) +
  geom_density_ridges() +
  labs(
    x = "",
    y = "",
    title = "Highway Milage (mpg) for Different Car Manufacturers"
  )
- Using code chunk options, make it so this chunk shows the code but not the output:
2 + 2- Using code chunk options, make it so the file can still knit even though this chunk has an error
2 + aError: object 'a' not found- Using code chunk options, create a descriptive
labelfor each of the code chunks above.
Data Wrangling Review
Since you already seen some ggplots, let’s do a bit of review on data handling. In this class, we will exclusively make use of tools from the tidyverse suite of packages to perform our data cleaning and wrangling operations. If you are less familiar with these packages or it’s been some time since you used them, I would strongly recommend referencing the function documentation!
For these problems, we will continue to work with the mpg data frame, making various changes to the data to clean it up.
- The
flvariable describes the type of fuel for each car, with levels:p,r,e,d, andc. Do some research into what each of these labels mean! Then, use theif_else()function to create a new variable (fuel_type) with two levels:petrol(any car using petrolium-based gas) andalternative energy(any car not using petrolium-based gas).
# https://stackoverflow.com/questions/25548656/ggplot2s-mpg-dataset-whats-the-fl-variable
clean_mpg <- mpg |>
  mutate(
    fuel_type = if_else(
      fl %in% c("r", "p", "d"), # regular, premium, diesel
      "petrol",
      "alternative energy" # ethanol, compressed natural gas
    )
)- The
drvvariable describes if the car has front drive (f), rear drive (r), or four wheel drive (4). Let’s make better labels for these values! Specifically, use thecase_when()function to change thedrvvarible to have the following levels:front,rear,four wheel.
clean_mpg <- clean_mpg |>
  mutate(
    drv = case_when(
      drv == "f" ~ "front",
      drv == "r" ~ "rear",
      drv == "4" ~ "four wheel"
    )
  )
(string split + remove extra “)” )
- The
transvariable contains two pieces of information, (1) the transmission style (autoormanual) and the specific type of transmission (e.g.,l5,m5). Using thestr_split()function, create a new variable (trans_type) containing the specific type of transmission of each car. Once you’ve made this new variable, use therename()function to change the name of thetranscolumn totrans_style.
Hint: You will need to deal with the stray parenthesis!
clean_mpg <- clean_mpg |>
  separate_wider_regex(
    trans,
    patterns = c(trans_style = "[^()]+", "\\(", trans_type = "[^)]+", "\\)")
  )
Getting to know your classmates
- Find someone who took Stat 331 from a different professor than you. Compare your experiences. Tell me their name and professor. List one or two things that you think you learned more about, and one or two things that they learned more about.
I spoke to Matt Babb who took STAT 331 with Dr. Robinson. He learned a lot more about Shiny, and did more outside of class. I don’t remember learning any Shiny in 331. Matt did some cool work with Shiny and made a Life Wheel. I learned more about OOP and modelling through my own ventures. Matt said he enjoyed his experience and thought it was fun, albeit frustrating.
- Find someone in the class who does not share your birth month. Tell me their name and birthday, and use R to find out how many days apart your birthdays are.
library(lubridate)

interval(ymd("2005-08-26"), ymd("1992-12-21")) |>
  as.duration() |>
  as.numeric("days") |>
  abs()
[1] 4631